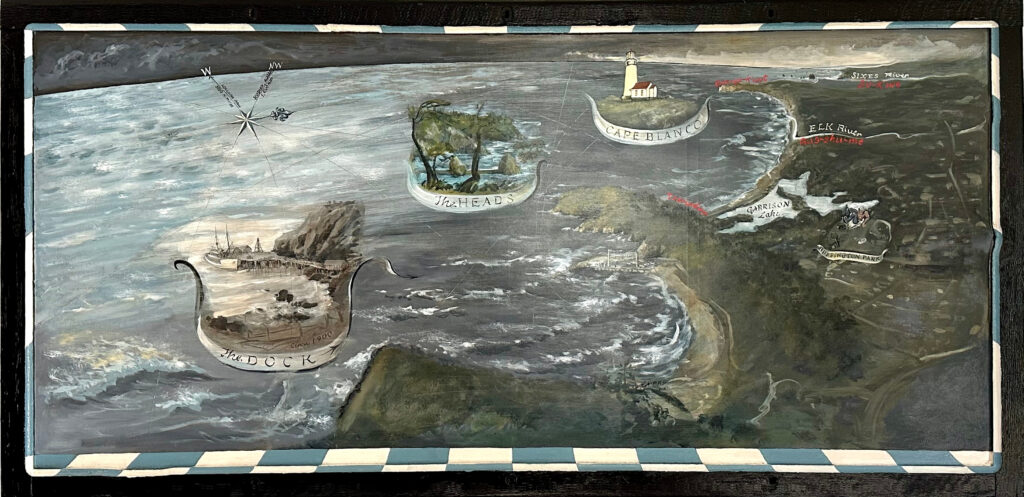
Cape Blanco and Port Orford are often a subject of topographic interest due to their unique geographic location. Cape Blanco is the most westerly point in Oregon and second only to Cape Alava, WA, in the contiguous U.S. (NOTE 🎵 Cape Blanco was the most westerly point in the contiguous U.S. for 30 years before Washington officially became a state in 1889). Port Orford is the westernmost incorporated city on the U.S. mainland (contiguous 48 states) as well as being the oldest townsite on the Oregon Coast.
However, our locale’s affinity with the chart doesn’t end with terrestrial maps. We are also connected to the most beautiful blue skies and ocean vistas on the planet. Our sky is such an arresting shade of blue, in fact, we decided to chart this phenomenon as part of the Cape Blanco Weather Station Project.
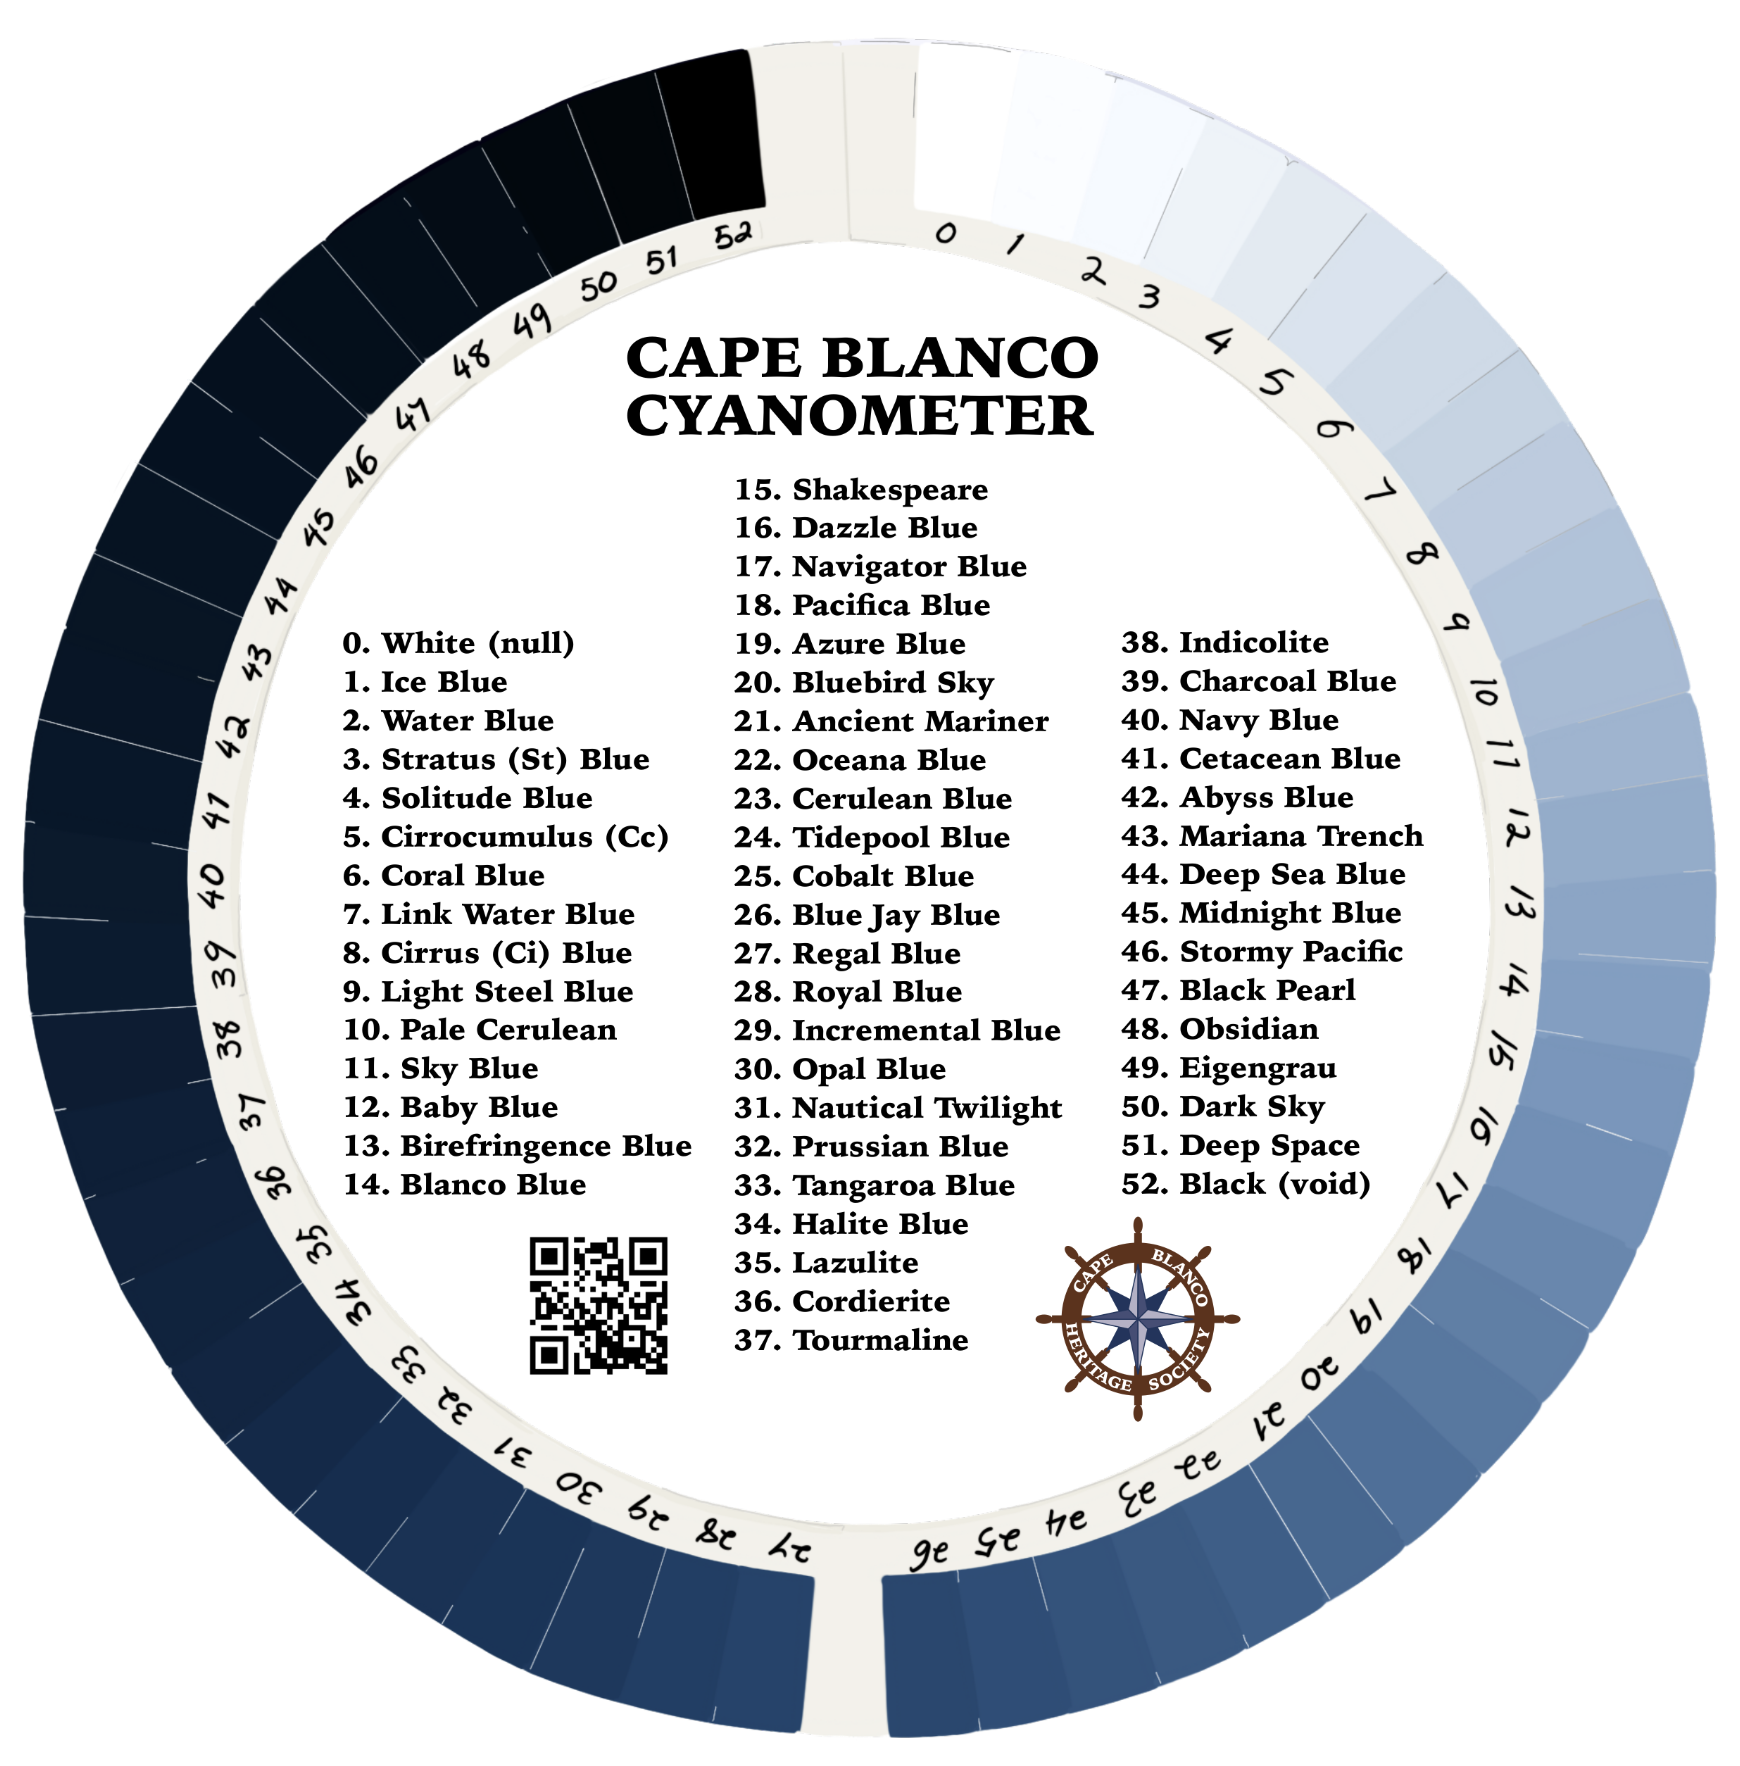
A cyanometer is an instrument for measuring “blueness”, specifically the color intensity of blue sky attributed to inventors Horace-Bénédict de Saussure and Alexander von Humboldt. A cyanometer consists of squares of paper dyed in graduated shades of blue and arranged in a color circle that can be held up and compared to the color the sky. De Saussure, a Swiss physicist and mountain climber, is credited with inventing the cyanometer in 1789. De Saussure’s cyanometer had 53 sections, numbered cards, ranging from white to varying shades of blue (dyed with Prussian blue) and then to black, arranged in a circle; he used the device to measure the color of the sky at Geneva, Chamonix, and Mont Blanc. De Saussure concluded, correctly, that the color of the sky was dependent on the amount of particles, water droplets and ice crystals, suspended in the atmosphere. Humboldt was also an eager user of the invention on his voyages and explorations in South America. He took the tool on an ascent of the Andean mountain Chimborazo, where he set a new record, at the 46th degree of blue, for the darkest sky ever measured thus contributing to de Saussure’s scientific discovery.
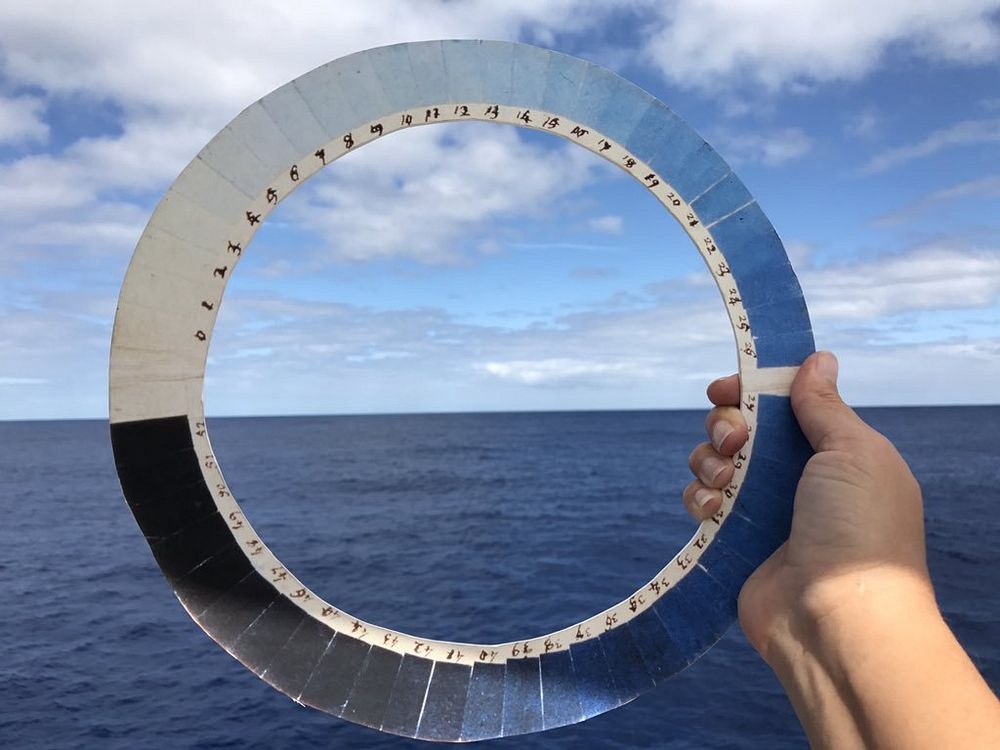
The Cape Blanco Cyanometer is a functional device. Print out the image and enlarge to suit. Cut as neatly as possible around the outer ring and cut along the grey line of the inner ring to remove the color palette names as a separate reference sheet. Hold the ring up to the sky to measure blueness.
The blueness of the sky is not the only quantification that has bemused scientists — a 180° turn of the cyanometer begs the question: how dark is the night sky?
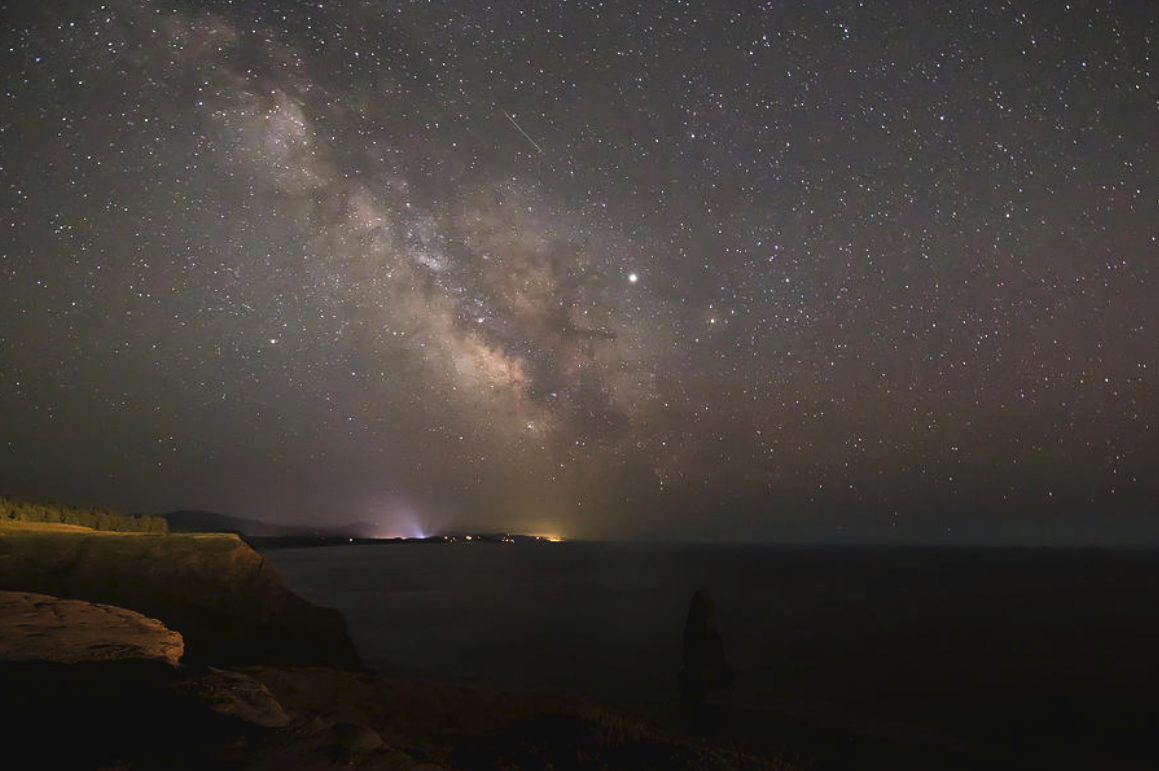
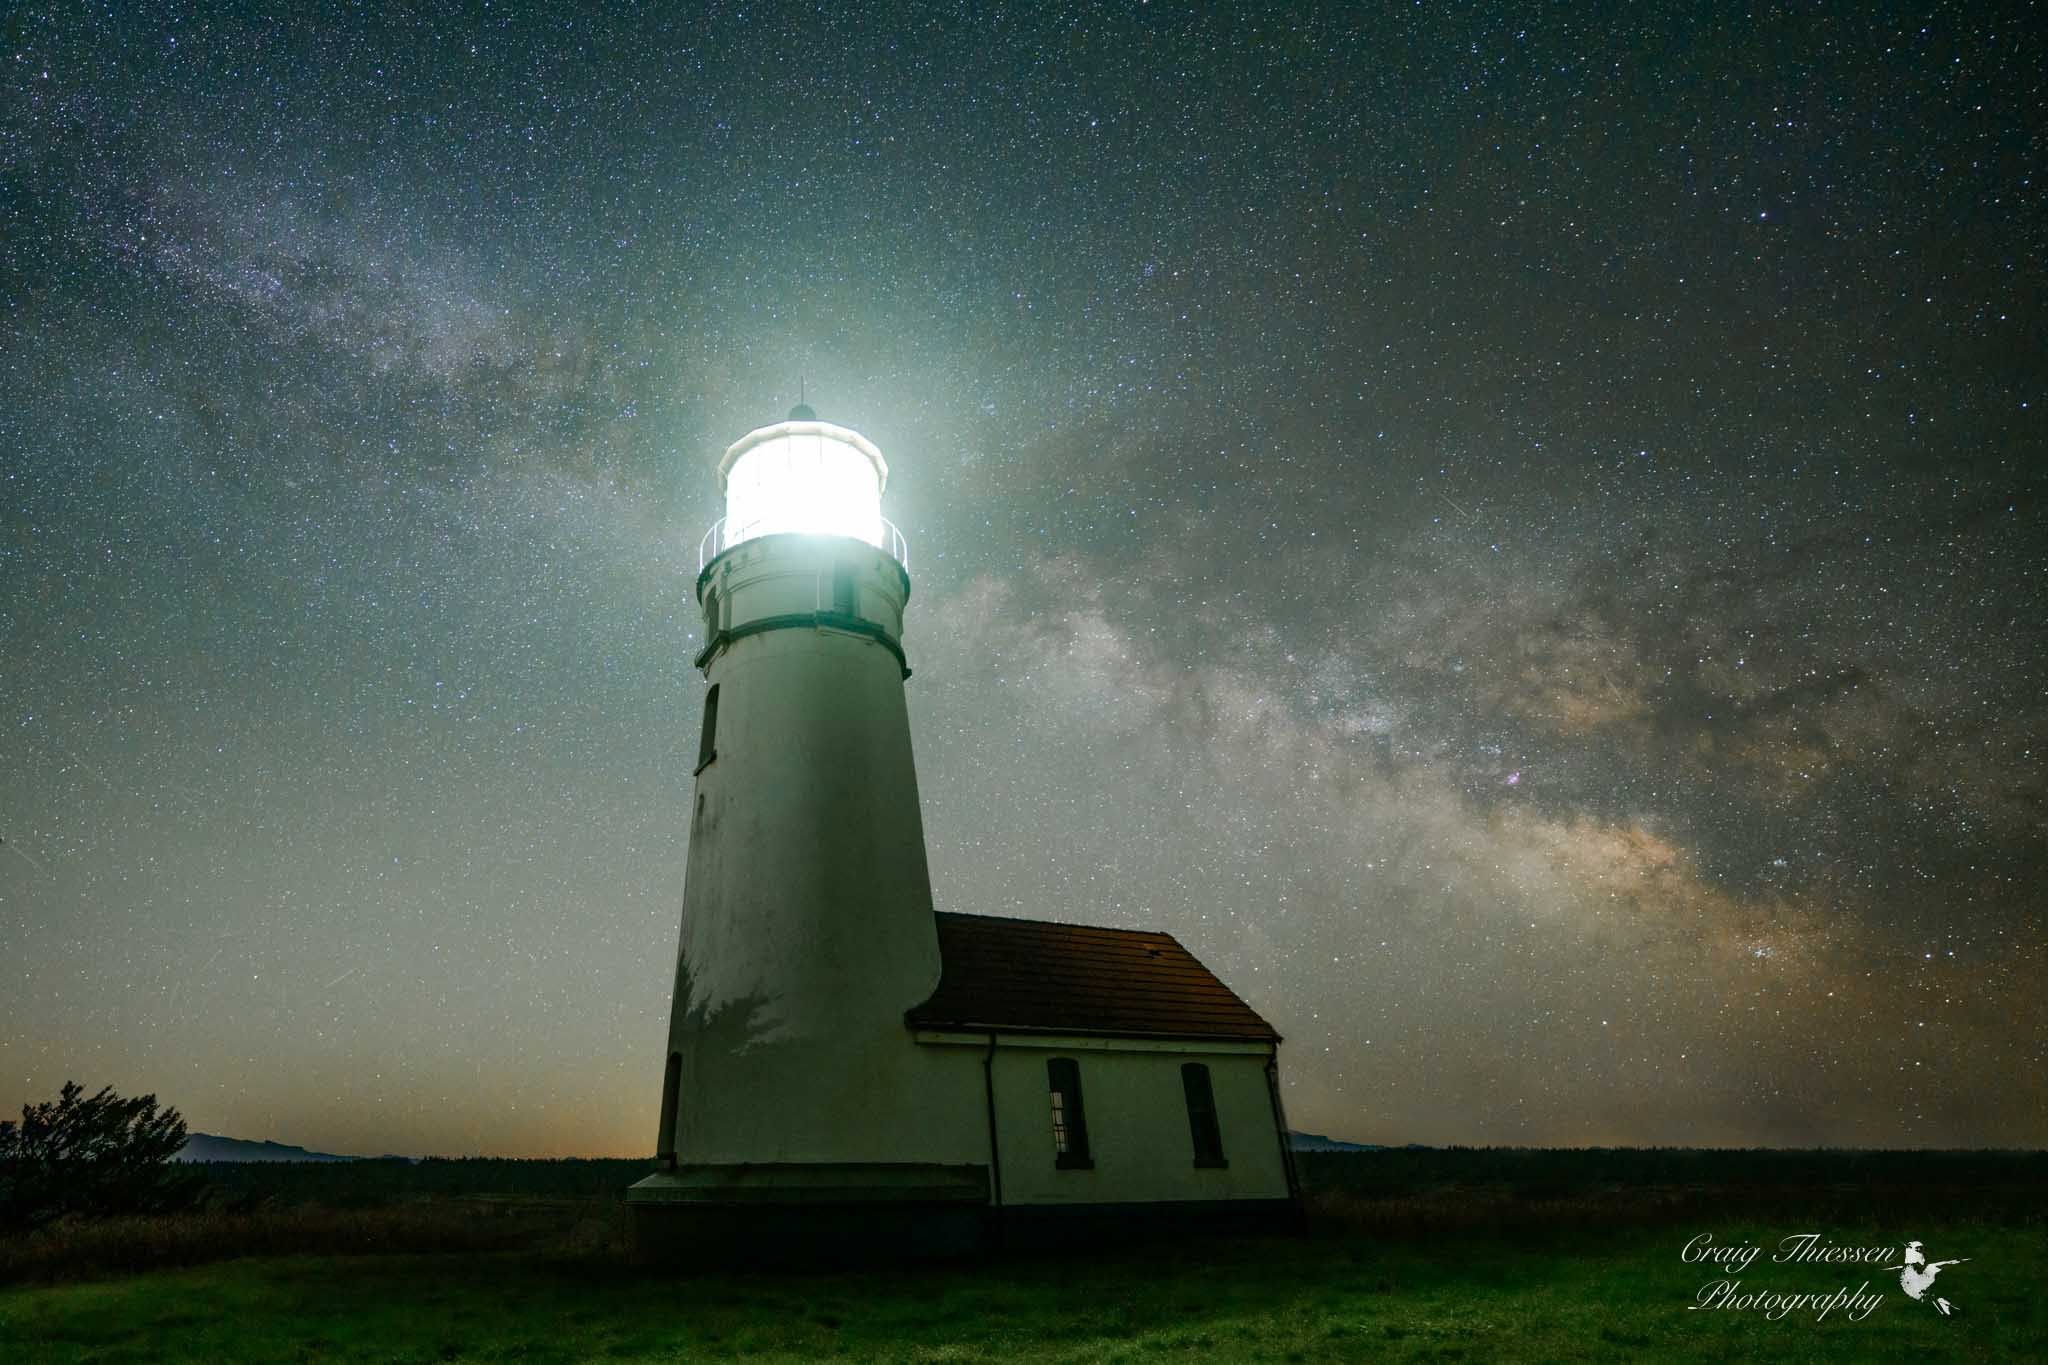
A scientific method of measuring the darkness of the night sky and the impact of light pollution on astronomical observation was developed by amateur astronomer John E. Bortle and published in “Sky and Telescope” magazine in 2001. The Bortle scale is a 9-level numeric rating system that ranges from Class 1 (pristine dark-sky site) to Class 9 (heavily light-polluted inner city).
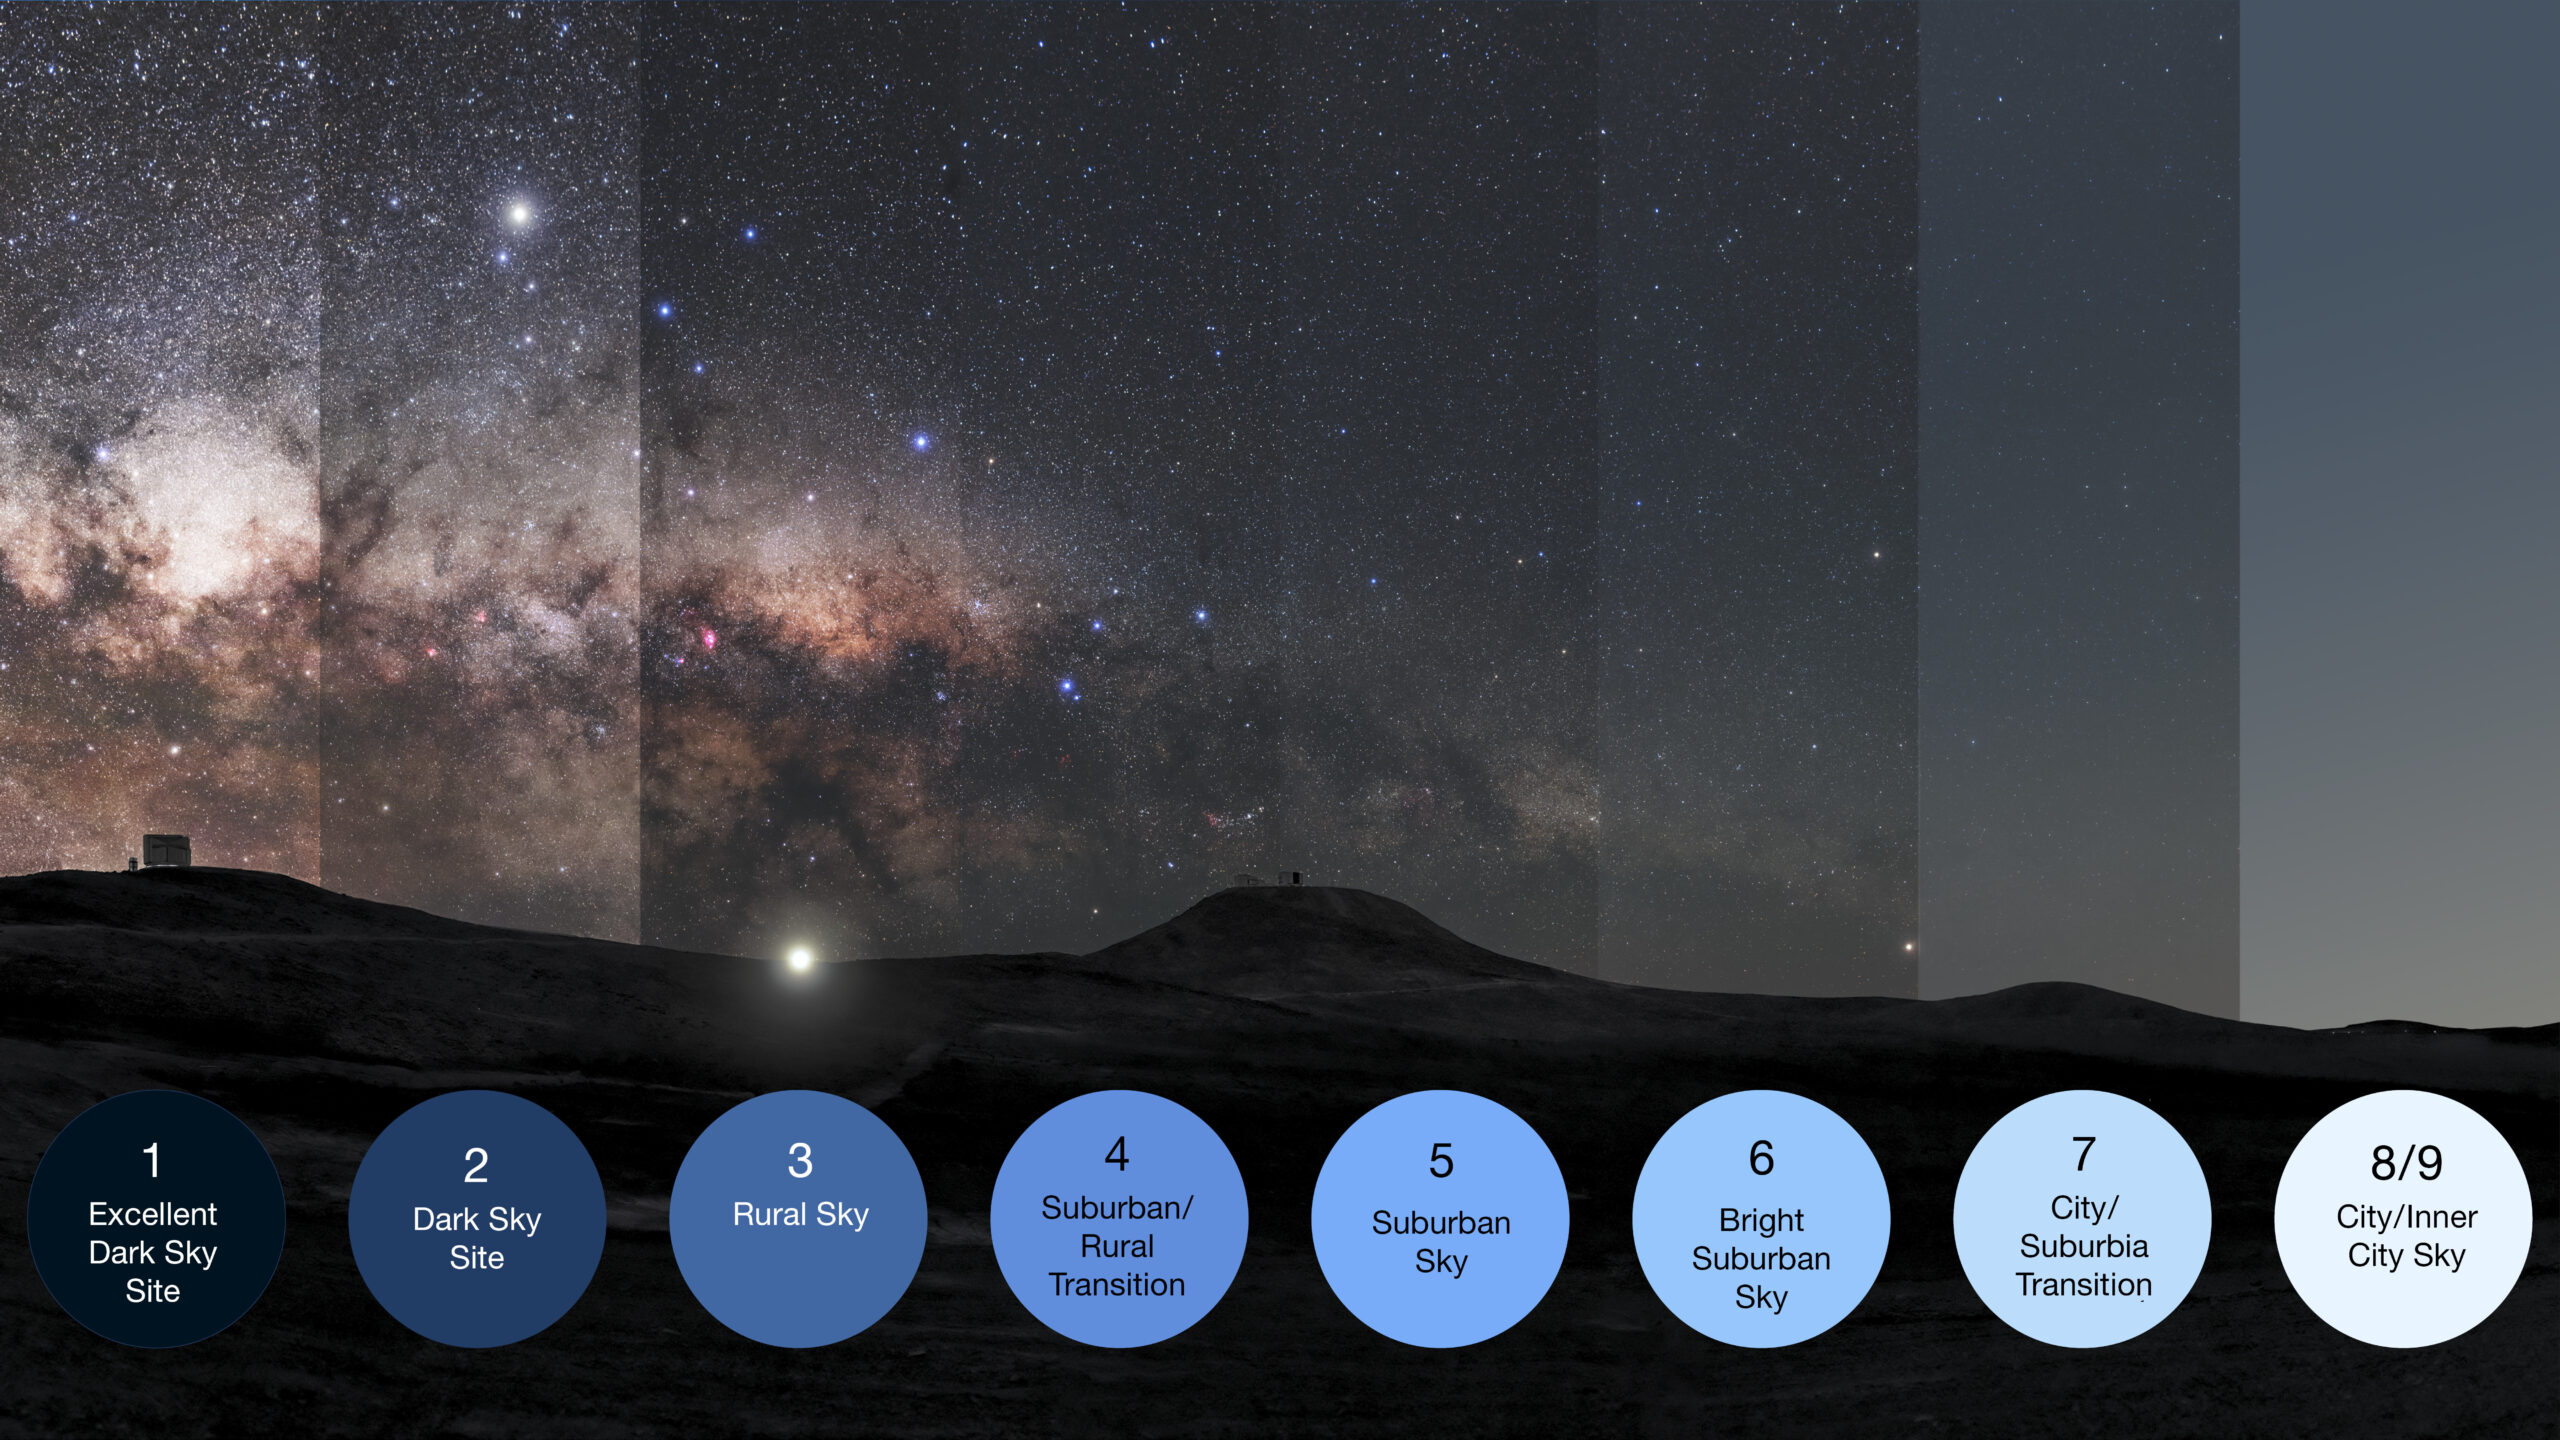
The image above illustrates the Bortle scale, which measures the impact of light pollution on the dark skies at a given location. It shows, from left to right, the increase in the number of stars and night-sky objects visible in excellent dark sky conditions compared with cities. The illustration is a modification of an original photograph taken at ESO’s Paranal Observatory in Chile, a place with excellent dark-sky conditions, perfect for astronomy.
According to the Stargazing Hub Light Pollution Map (see below), Cape Blanco is a 2.3 Bortle and Port Orford is a 4.1 (as measured from the center of the urban growth boundary).
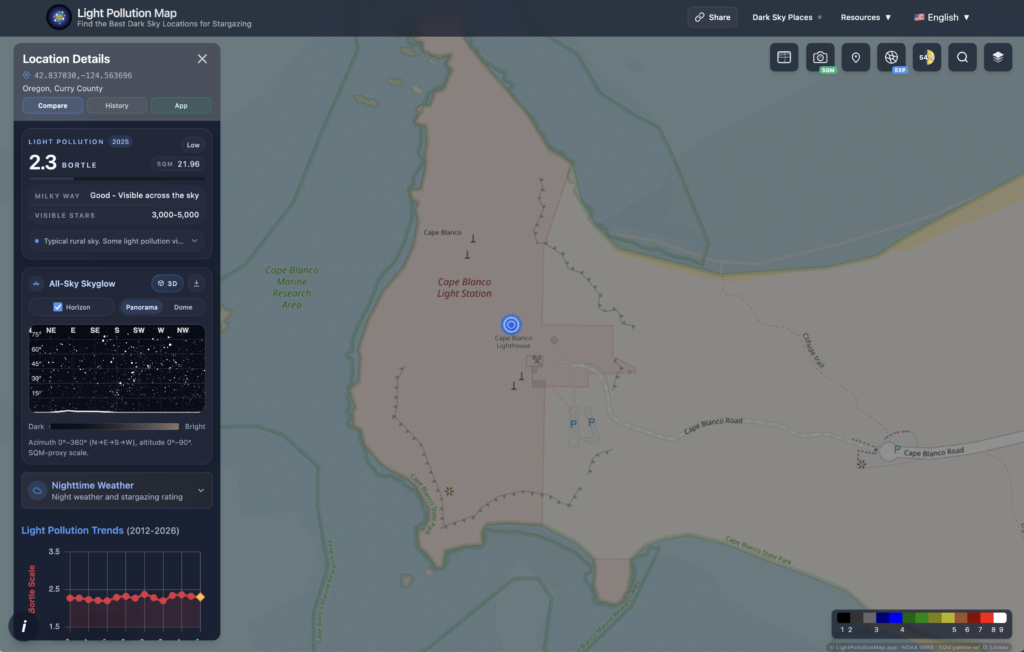
Stargazing Hub is a complete observing toolkit for astronomy enthusiasts, astrophotographers, and anyone starting to explore the night sky. It brings together a real-time star map, sky image recognition, observing forecasts, light pollution maps, satellite passes, and practical imaging tools so you can decide when to go out, where to observe, what to look for, and how to frame your shot. This app as well as PhotoPills should be in every night sky photographer’s toolkit.
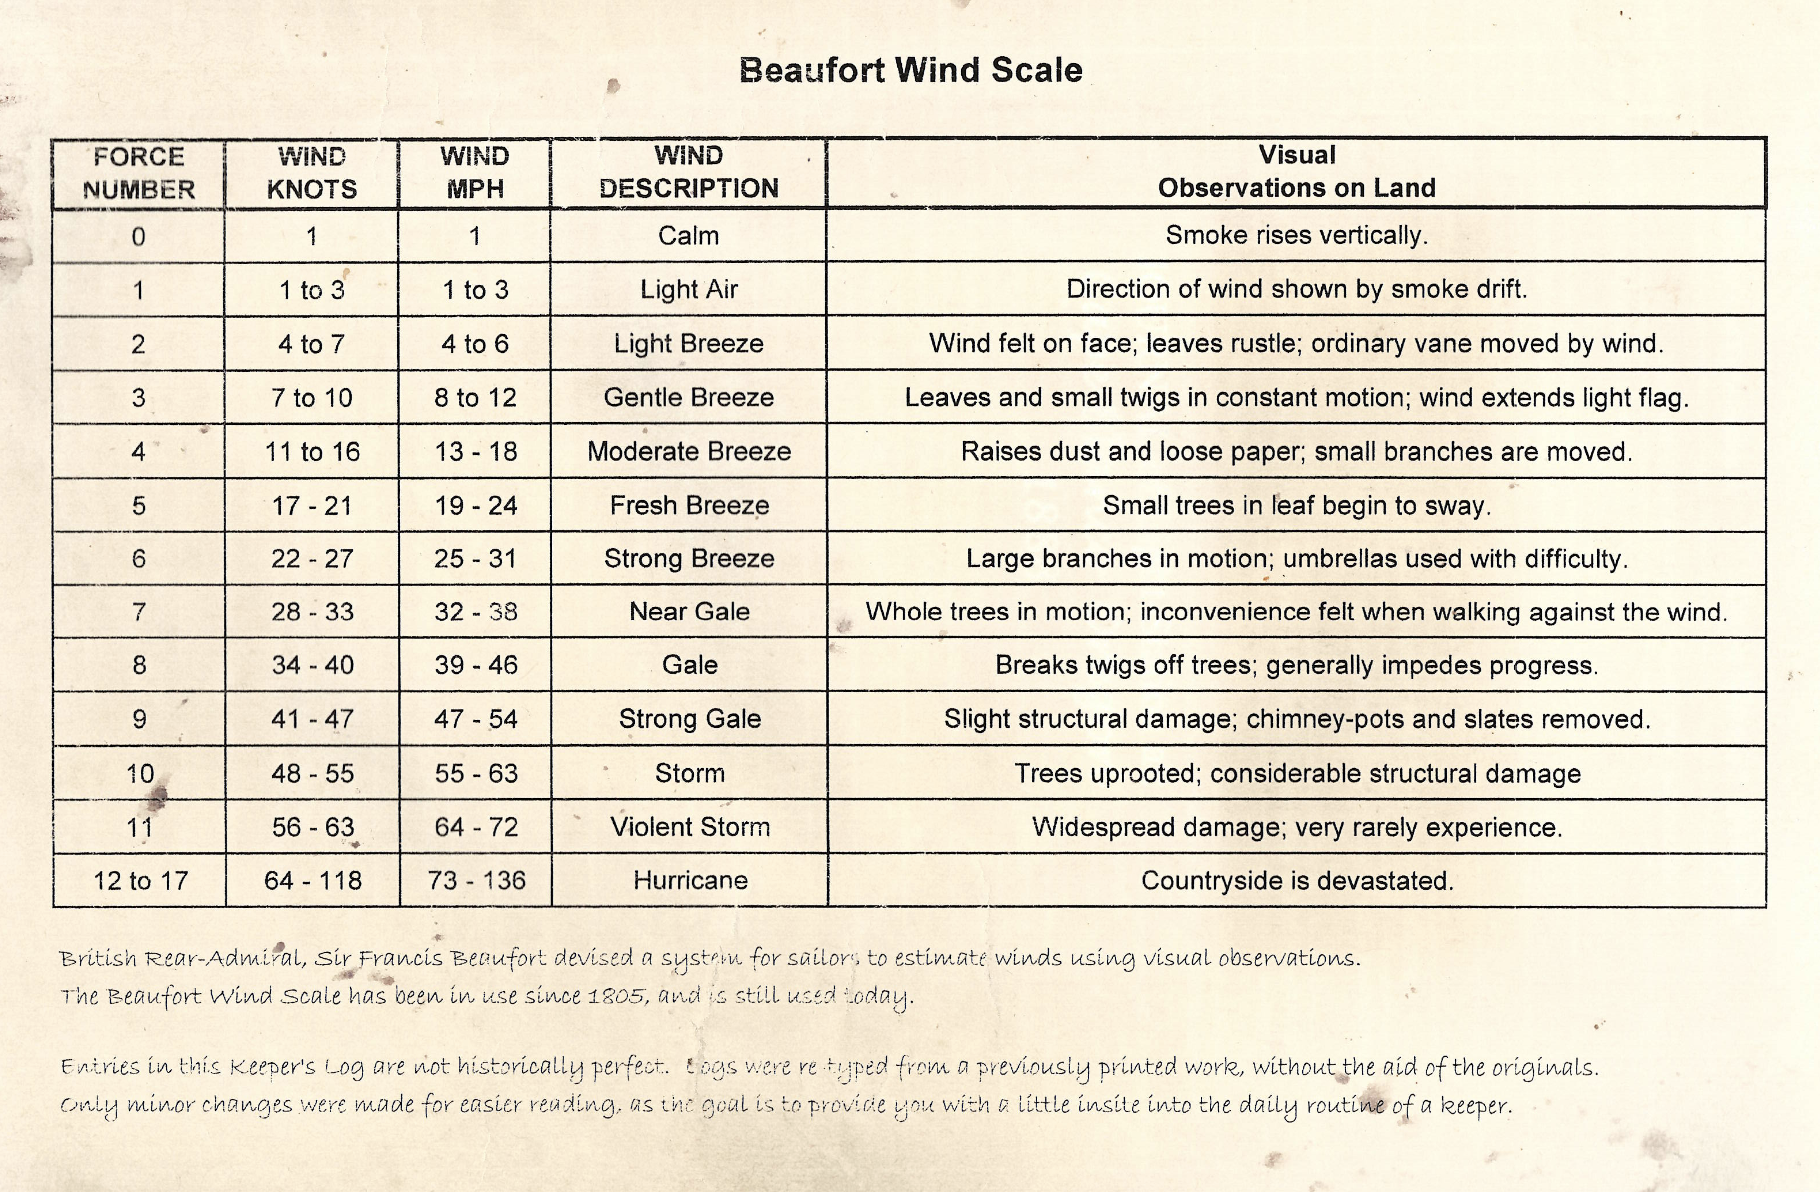
Moving on to wind which our area is famously known for, the Beaufort Wind Scale is an empirical 13-point system (ranking from Force 0 to Force 12) used to estimate and report wind intensity based on observable effects on land and at sea. Developed in 1805 by British Royal Navy officer Sir Francis Beaufort, it standardized weather reporting across the fleet without requiring specialized instruments like anemometers. It provides poetic, descriptive markers for conditions ranging from calm, resting air to a devastating hurricane. The Beaufort Wind Scale is another tool used in daily reports for the Cape Blanco Weather Station Project and it is the primary visual metaphor for the Cape Blanco Wind Speeds (BETA) app developed specifically for the lighthouse by David Mott.
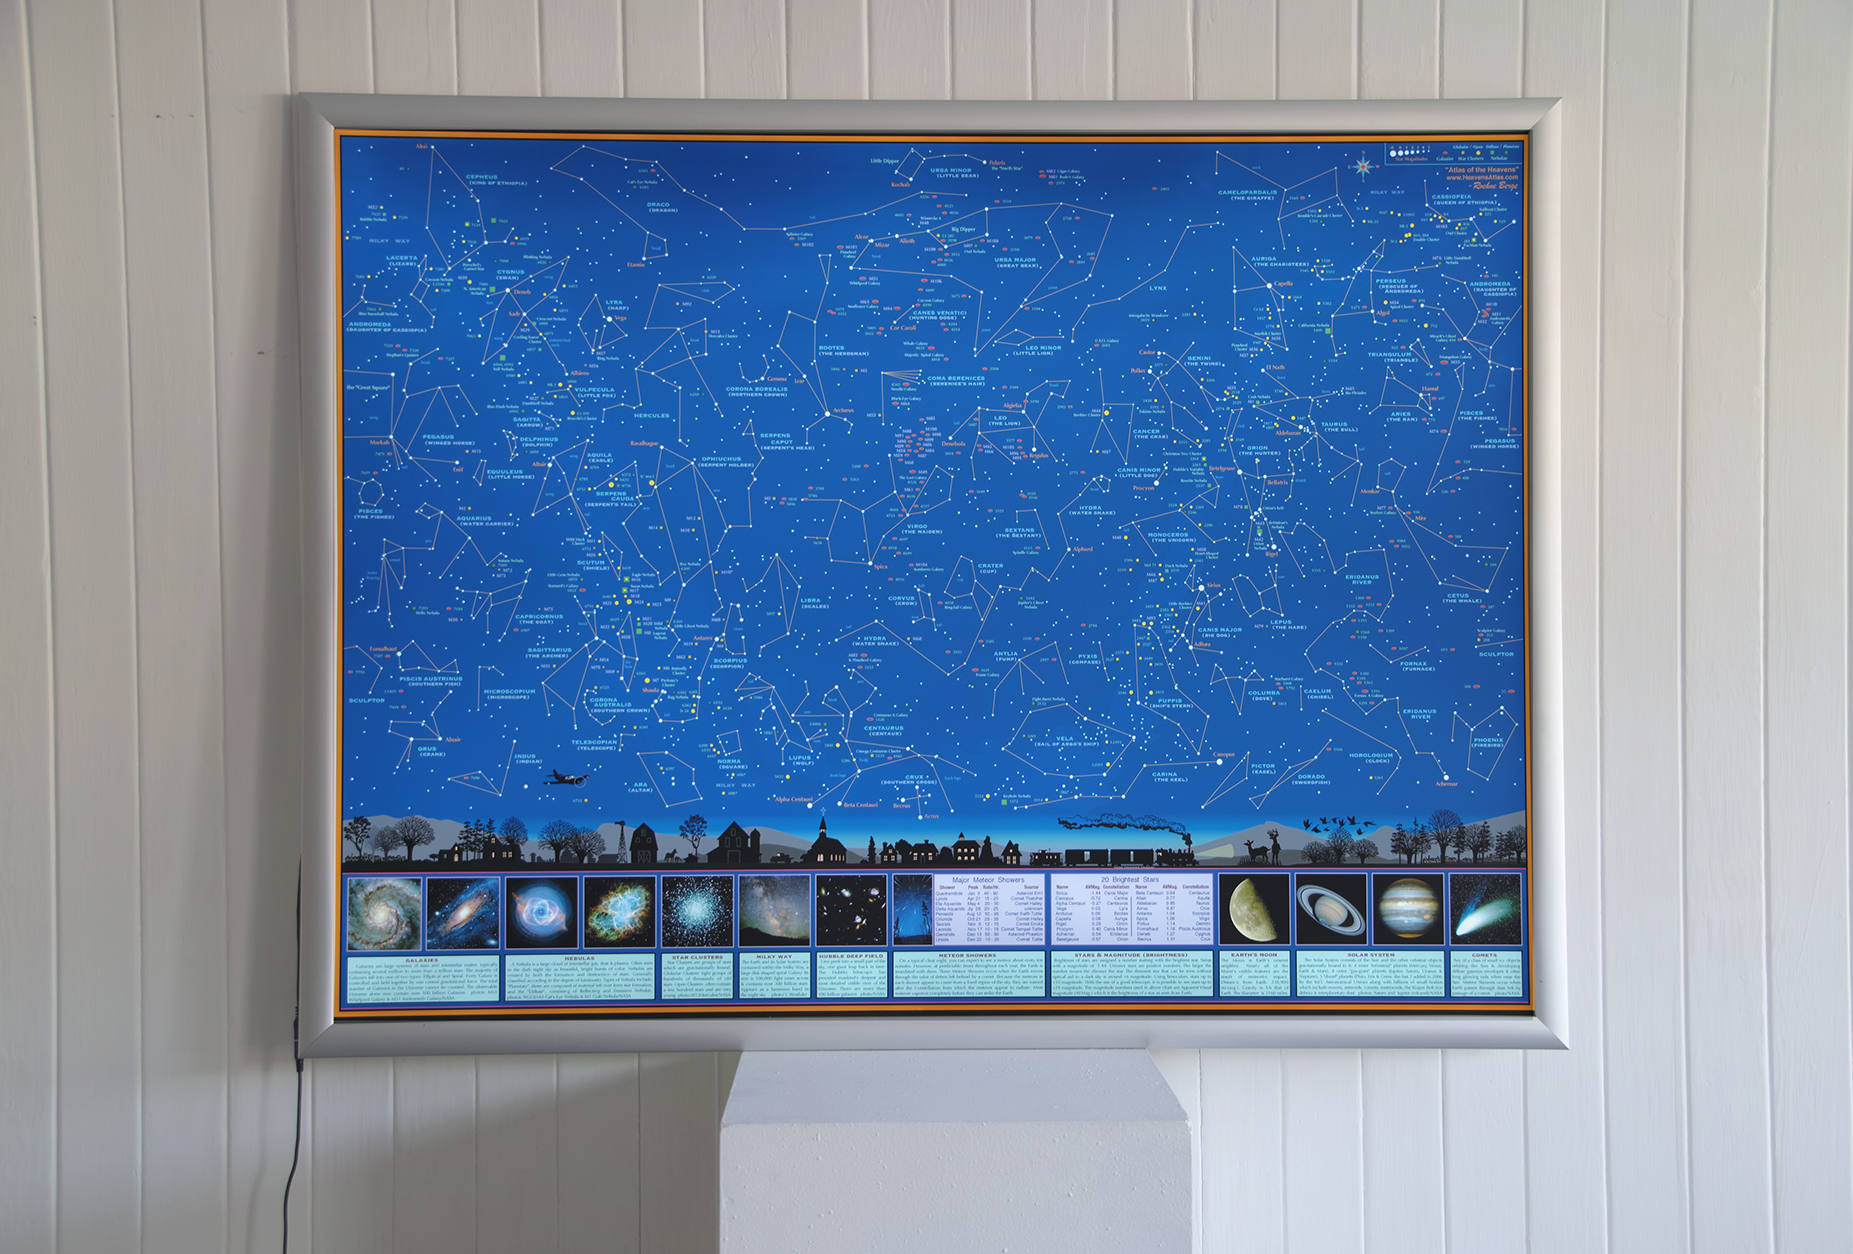
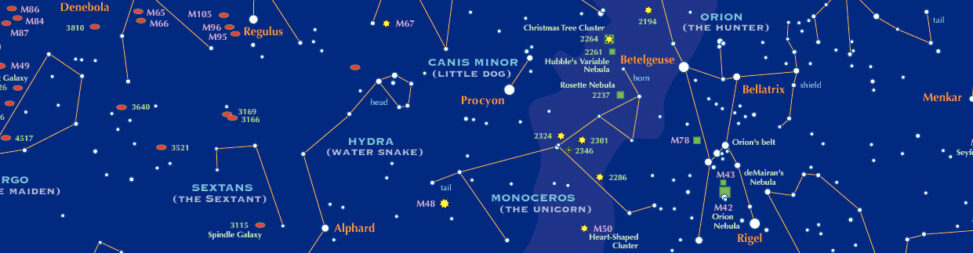
An overview of Port Orford sky charts is not complete without mentioning Rocke Berge’s “SKY-MAP / Atlas of the Heavens”. Rockne’s sky map is an intricate exploration of the night sky for anyone interested in learning more about the heavens. The artist started with his own photograph of the Port Orford night sky and illustrated further fine detail using Adobe Illustrator. It is definitely a great starting point for further exploration, and features many minor planets and celestial bodies. The capture below shows the level of attention to typographic and design detail.

Check back soon and we will make a similar voyage through Port Orford and Cape Blanco exploring maps and charts of the ocean in the next “Design Matters” article!
Leave a Reply